DevPulse — Performance HUD for Developers
Real-time performance overlay for web developers. Monitor FPS, DOM nodes, memory, long tasks, and Core Web Vitals — right on the page.
Performance monitoring without the overhead
Real-time metrics on the page — no DevTools panel, no context switching, no setup.
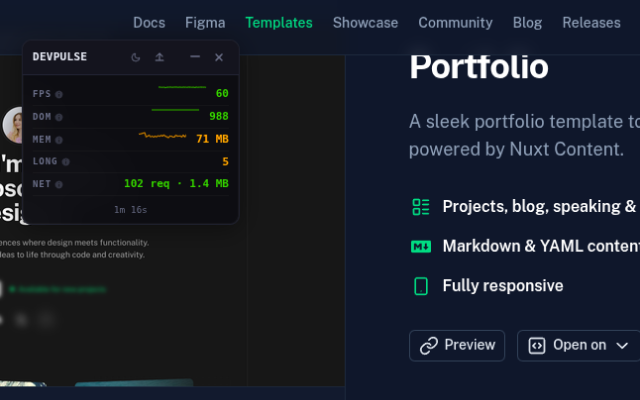
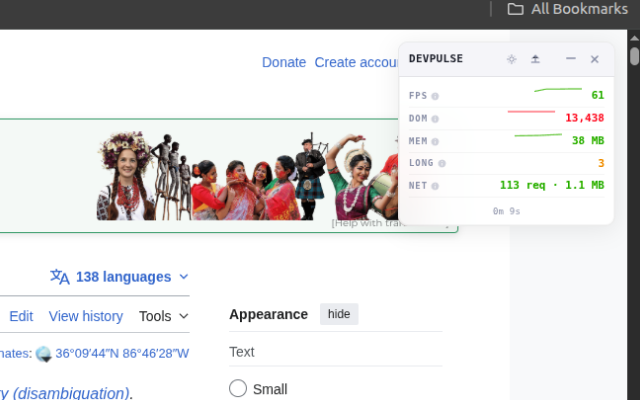
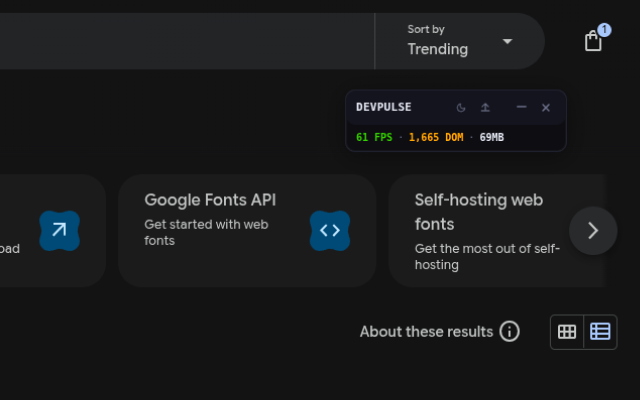
- Real-Time FPS & DOMMonitor frames per second and DOM node count with live sparkline history. Color-coded thresholds highlight performance issues instantly.
- Memory & Long TasksTrack JS heap memory usage and detect long tasks blocking the main thread. A live badge shows recent long task activity.
- Core Web VitalsMonitor First Contentful Paint and Largest Contentful Paint with color-coded thresholds matching Google's performance guidelines.
- Network OverviewSee total request count and transfer size at a glance. Spot unexpected network activity without opening DevTools.
- Dark & Light ThemesSwitch between dark, light, and system themes. The HUD adapts to your preference and remembers it across sessions.
- Shadow DOM IsolationThe HUD runs inside a closed shadow DOM — it won't interfere with your app's styles, frameworks, or DOM structure.
Frequently Asked Questions
Everything you need to know about DevPulse.
Free core metrics. Premium for $2.99.
FPS and DOM monitoring are completely free. Unlock memory, long tasks, Web Vitals, network stats, and JSON export with a one-time $2.99 purchase. No subscriptions.